Mini Review - (2023) Volume 11, Issue 1
AN OVERVIEW DATA VISUALIZATION OF POPULATION HEALTH
Mrinmoy Roy* and Bhargavi BoddetiReceived: Dec 21, 2022, Manuscript No. IJCSMA-22-84400; Editor assigned: Dec 28, 2022, Pre QC No. IJCSMA-22-84400 (PQ); Reviewed: Jan 15, 2023, QC No. IJCSMA-22-84400 (Q); Revised: Jan 23, 2023, Manuscript No. IJCSMA-22-84400 (R); Published: Jan 30, 2023, DOI: 10.5281/zenodo.7824523
Abstract
The significance of Data Visualization are as follows: Effective decision making; Quick results; Minimize errors; Accelerated Performance; Identifying high risk patients. There are following scope of Data visualization such as: With the usage of EHR large amount of data is generated; Health data Visualization is becoming popular over last few years; Visualization of the data can help in better management decisions. The following tools are used: Data Visualization Tool-Tableau; Data Stimulator- Synthea.
icsatc neodeme advancedstructurescorp floormachinebrush scpe jcamasonry sages-tunisie sbsteel technomailleplus bolkan vaalea nsblueprinting mycleanairdoctors nycgeneralproroofing gabgadgets prsnekkern uniquescaffoldingsystems villaguicciardini acerpackaging acjstucco prontointervento-multiservice printersupplygiant sarel takkatiimi dragonshollow mazelsupply alfalchetto reliablegeneralagency lckenterprises realizzazione-giardini dmcindustries shop chathambrass ilfaroservizi soilmechanicsdrilling colorfullyyours agcsound carriere carnavaldetournai falconauto codingxcamp davinci-trondheim thebestofcolumbia cooperativetissage outsourcedmarketingpros tlc dawnnhough doubleclick pdirealty hattrennet az-bizsolutions jamaistropdart frontdata unitycreations fortisarezzo bspo-ken codar-confection theboulders bakerpersonnel fantasyphotographyandvideo fuleky tanssikoulutria ladybi swimanddance scuolavelatoscana x-pack creativeglazing lucagnizio sigaretteelettronichepisa mayiindustries frigo-clim elgars leoemma hotelalcantara el-pro therefore thebestofjacksonville nykran masmoudi thebestofspokane cogepre detrecruitment laresidencelepartage chimneycompanyboston awarepedia res-botanica recipefy semap thebestofcincinnati bb-one fourtech thebestofjoliet ajproduce jerryshulmanproduceshipper lckcabinetryny drivingtechniquesmadeeasy accademiaestetica pizzamaison schoonheidssalonbianca cabinsbrevardnc mrbrushes atlasrolloff hatip-medikal vezcocorporation thebestofcoloradosprings filtaclean monteleeper flyfisher ellatafa associazionepugliesiapisa unitycreationsltd maketeamstudiot douglasclear packagingpro softm allstarbeerinc burtonsupply footballscouting profondacreation johnvravickddsms fireislandbuilder advancedcontrolsolutions chittorgarhtaxiservices live-now orologeriatoscana racinemode thebestofwilmington agro-services violiner sandinghouse the-complete-package thebestofrichmond rcollision meubleskarray mes-recettes lawsandtaxes tavgrupp mkproducts royscottmarine taxi contreras-stockman sigmaweb de-noord thebestofkansascity maisonmedicaledelaeken recycledrubberpavers surfacingsystems unitedfidelityinc enokplan hunterremodeling edmersupply amerequipint sanilabcorp igglesis christiannursingregistry united-royal cantodelfiume northsidedeliny menuiserie-delbart passeritartufi justmyvoice ablefiresprinklers accantoalcentro ckperformance khalfallahpneus anti-flood-barriers bmstyle autosangiorgio-mercedes-benz carmagnino viipurinurheilijat multipack cma-eng mcafeerealty adrianaperciballi loconteedilecostruzioni konarprecision unityrubberco unityrubberproducts dante tela marathongranite baltimahalworcester heimdalbygg alstateprocessservice italydreamtour wemcocastingllc yachtbritesigns ecoledecroly-renaix anchorseniorapartments royalburton sk-veilag giannacapoti hubiteg customcommercialconstruction edm-nivelles probat-tunisie bachlawyer robertex inbora gpbconstruction tekstschrijver-tim bdsit trepro himalayanlounge lazersharpplumbing nycollisionking marinanova gealcorp nygabe maritimecoverage justmyvoice jukumech quimicolsa hayat-med aldrovandiauto michaelbenaltinc korenas sandvet americanmufflerautorepair justmyvoice liacoustics dminteriors agenziapromotech ligbtour internormfirenze justmyvoice zouila kohalmiferenc ashgroveresort ilmacinapepe suzukibandit hihna islandfishli prontointerventofabbro24h thebestofmidland thebestofportland dsgnaturaeambiente rimpex-medical giadaguidi royalroseappliances normas monicavignoliniluxury reddalsand defigners projektorilamput qtbservices labandas totalconceptdesign elannonnayttamo begmaterialiedili bardsdans samuelmanndds marksmenmfg demo17 chinafinewines coralia ivar-moe tournailesbains consew luisaprofumeriashop chimneycompanywestchester danapoly 268dental uspaerospace melonerp matcoservice emperorsoft cantare fninc greenpowerchemical westendsupply domobios unitysurfacingsystems martemoen hamptonssepticservices housatonicpaper sj-transport epsl-tunisie sungoldabrasives collinscreative barbarottomachinery soep thebestofalexandria straightlineconst itcimpianti hattrem-trafikkskole federalnetworks ppattorneys ceteau fbperformance coltgateway coolservice4u garaconfection bellformalwear abcconcretepumping mysantaria accurateindustrialmachining schmugerhardware thebestofjackson bellwetherstaffing sweetkarmadesserts tonerhuset mongilschool polycliniquelaouani buonidentro schoolbusmirrorsonline qlstransportation andereuropa cleanpressiondrycleaner bsyd planetlimony thebestoflasvegas csgmfoodequip potensial potiez invitiing tomscorvetteshop thebestbaltimorebusinesses honefoss thebestofoakland hydeparkdenim scmanndds sirreal totalpreferredsupply futureshockcorp myrtun
Keywords
Anagrelide; Vasculitis; Essential thrombocythemia
Introduction
Synthea
Synthea is a Synthetic Patient Population Stimulator which is used to generate the synthetic patients containing realistic patient data of the state of Massachusetts, USA. It mirrors the real population in terms of demographics, disease burden, immunizations, medical visits, and social determinants (Figure 1). It is developed by MITRE corporation that uses a vast array of diseases, treatment plans, medications, insurance claims transactions, allergies, medical equipment’s, imaging studies, observations, conditions. Synthea’s clinical disease modules are created by the community using a combination of clinical care protocols, publicly available disease incidence and prevalence statistics, and clinical expert feedback. Synthea uses these modules to generate synthetic health records, simulating the progression and treatment of disease from birth to death [1].

Figure 1: Project detail wrt to synthea.
2. Parameters for visualization
2.1 Medication across disorders
This Figure 2 is created with Medications Comma Separated Values (CSV) and Patients CSV established a relationship between them with matched fields. It tells about the most prescribed drug for a particular disorder. This can help in knowing the drug which used is available to meet the demand and helps in maintain Inventory and Stock Management [2].
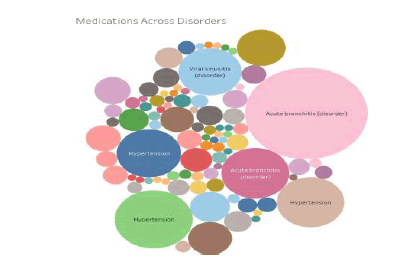
Figure 2: Medication across disorders
2.2 Billing patterns across disorders
This dashboard is created between encounters.csv and patients. Comma Separated Values (CSV). This dashboard tells us about the average healthcare expenses across genders. It also gives information which diseases are exclusively reported between genders. It can also show cardinality between gender, disorders and Healthcare Expenses (Figure 3).
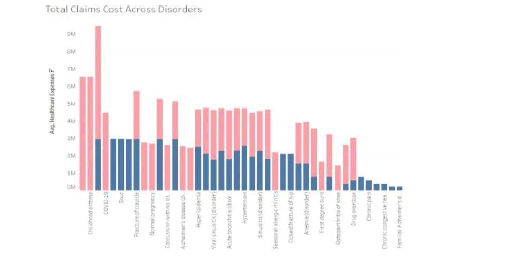
Figure 3: Billing patterns across disorders
2.3 Allergies across disorders
This dashboard between allergies.csv and patients Comma Separated Values (CSV). This dashboard gives information between allergic substances found in particular disorders [3]. As per the data, it shows that acute bacterial sinusitis, pharyngitis, bronchitis, asthma, rhinitis conditions report most of the allergies with animal dagger, dust mites, pollen, milk, mold and shellfish (Figure 4).
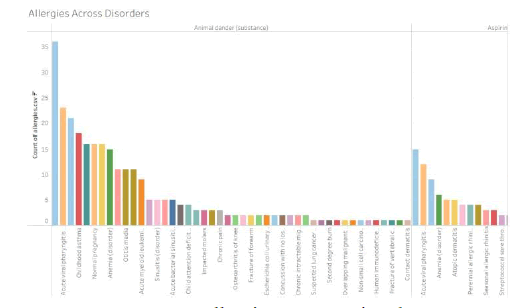
Figure 4: Allergies Across Disorders
2.4 Geographical distribution of disease
This dashboard is created between patients.csv and encounters Comma Separated Values (CSV). It shows which distribution and location of disease with number of patients infected with that particular disorder [4, 5]. As per the given data Suffolk County shows more distribution of diseases such as Ecoli, Appendicitis, Congestive Heart Failure (CHF), Covid-19, Drug Overdose etc. (Figure 5).
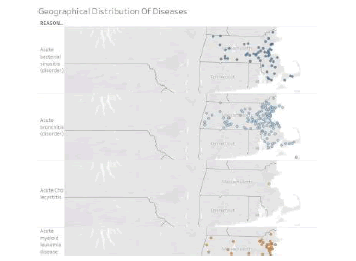
Figure 5: Geographical distribution of disease
2.5 Advanced land observing satellite (ALOS)
This dashboard is created by using encounters.csv. Here first calculated Average Length of Stay (ALOS) which is calculated by (ALOS) by ALOS= Date of Discharge-Date of Admission [6-8]. Then filtered encounter class for Inpatients and Emergency care admissions. As per the data, ALOS is more for Inpatients than Emergency admissions. The AVG ALOS=1 DAY but few conditions show prolonged length of stays. The Average ALOS for Inpatient and Outpatient Admissions =1 day. Except for few conditions it varies (Figure 6).
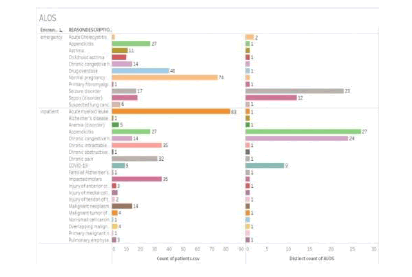
Figure 6: ALOS
3. Results
Synthea data comes with a developed framework. It scales via open source deployment on the Internet via get-up repository. One million patients records are available freely over their website and getup following with HL7, FHIR and CDA.
Conclusion
The current health care system has a three-tier structure for delivering health care services to different spheres. Patient health information is diversified across many levels of the health care system in which consistent data availability at the point of care is very much essential. Many healthcare sectors use hospital-centric approach to maintain and manage hospital information in which patient health information cannot be shared with another hospital at the point of care. A cloud-enabled standard Electronic Health Record (EHR) uses the patient centric approach in which patient health records are made available in an integrated and unified manner at the point of care. Capturing the Health data are done using standard coding’s such as Systematized Nomenclature of Medicine-Clinical Terms (SNOMED-CT), International Classification of Diseases (ICD-10), Logical Observation Identifiers Names and Codes (LOINC), Digital Imaging and Communications in Medicine (DICOM) and RxNorms. Electronic Health Record is need of the hour in India. Ministry of health and family welfare (Govt. of India) have recommended some guidelines for effective adoption of EHR. With increased usage of EHR; the data generated we can utilize it for data visualization which in turn helps us in better decision for policy making and increase operational efficiency. Healthcare Industry is lagging in adoption of IT, data exchange and interoperability. The unavailability of health records had hindered the innovations in healthcare. There by lagging in data visualization of patient’s health data.
5. Key recommendations
An electronic health record (EHR) with maintained standards using to link data within an EHR system or share health information between systems; Within a hospital there should be an EMR Implementation Analyst; Even a small clinic/nursing home can use open source EMR systems with minimal cost, maintaining standards with quality of data. Which increases the possibility of generation of data over a period.
6. Limitations
Synthea data doesn’t show any variation in the patient data which would occur at real scenarios Synthea data focuses more on care provided at hospitals; Whereas behavioral therapies and treatments administered outside the hospitals are not included Since Open-EMR is an application for US. Few entities needed to be changed and customized according to Indian Needs; Difficult to use Homeopathy and Ayurveda Clinics; Billing and Insurances needed to be changed as per Indian use case scenarios.
7. Scope for future research
With the need of hour of ABDM Implementation each hospital needs an Electromagnetic Radiation (EMR) Systems; Drug Dictionaries for Application Programming Interface (API) search for E-Prescription of drugs.
References
- Bhattacharya, I., & Sumeet, M. "Need for interoperability standards for healthcare in India." CSI J Comput. 1.4 (2012): 11-19.
- Fiebeck, J., et al. "Implementing LOINC-Current Status and Ongoing Work at a Medical University." GMDS. (2019).
- Lin, J., et al. "Data Migration from Operating EMRs to OpenEMR with Mirth Connect." ITCH. (2019).
- Masud, J. H. B., et al. "Deep-ADCA: Development and Validation of Deep Learning Model for Automated Diagnosis Code Assignment Using Clinical Notes in Electronic Medical Records." J Pers Med. 12.5 (2022): 707.
- Phansalkar, S., et al. "Challenges in exchanging medication information: identifying gaps in clinical document exchange and terminology standards." AMIA Annu Symp Proc. (2009).
- Rinty, M. R., et al. "A prospective interoperable distributed e-Health system with loose coupling in improving healthcare services for developing countries." Array. 13 (2022): 100114.
- Schweitzer, M., et al. "Data Exchange Standards in Teleophthalmology: Current and Future Developments." Health. (2022).
- Walonoski, J., et al. “Synthea: An approach, method, and software mechanism for generating synthetic patients and the synthetic electronic health care record.” J Am Med Inform Assoc JAMIA 25.3 (2018) 230-238.